Econometric Analysis of Large Cryptocurrency Mining Loads in Electricity Markets
An econometric study analyzing the electricity consumption behavior of large-scale cryptocurrency mining firms in Texas, focusing on price, temperature, and grid charge influences.
Home »
Documentation »
Econometric Analysis of Large Cryptocurrency Mining Loads in Electricity Markets
1. Introduction
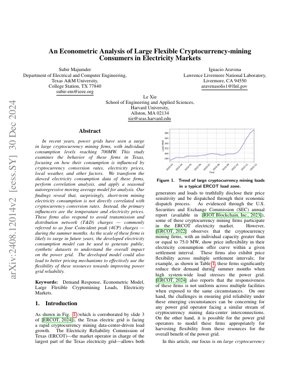
The Texas electric grid (ERCOT) is experiencing rapid load growth driven by large-scale cryptocurrency mining data centers, with individual consumption levels reaching up to 700 MW. This paper presents an econometric analysis of these "large flexible loads," defined as mining firms with individual capacity ≥ 75.0 MW. Contrary to initial assumptions, the study finds their short-term electricity consumption is not directly correlated with cryptocurrency prices (e.g., Bitcoin conversion rates). Instead, it is primarily influenced by local electricity prices and ambient temperature, and they strategically respond to avoid fixed Transmission & Distribution (T&D) network charges, known as the Four Coincident Peak (4CP) charges during summer months.
Key Statistic
700 MW – Maximum individual consumption level of a single cryptocurrency mining firm in the study.
2. Methodology & Data
The research employs a data-driven econometric approach to model the consumption behavior of cryptomining loads within the ERCOT market.
2.1 Data Sources & Preprocessing
Data was sourced from public ERCOT reports, SEC filings (e.g., RIOT Blockchain, Inc. annual report), and weather data. The highly skewed electricity consumption data from mining firms underwent transformation (e.g., log transformation) to meet the assumptions of statistical models.
2.2 Econometric Modeling Framework
The core analysis utilizes a Seasonal Autoregressive Integrated Moving Average (SARIMA) model. This time-series model is adept at capturing patterns, trends, and seasonal effects in the consumption data.
3. Key Findings & Results
3.1 Correlation Analysis
A pivotal finding is the weak or non-existent direct correlation between short-term mining electricity consumption and cryptocurrency conversion rates. The primary drivers identified are:
Negative correlation for miners indicates consumption decreases as temperature rises, opposite to general grid load.
3.2 Seasonal ARIMA Model Results
The fitted SARIMA model successfully captured the seasonal patterns in consumption, particularly the pronounced reduction during summer months. The model parameters confirmed the significance of lagged consumption values (autoregressive component) and past error terms (moving average component), along with a clear seasonal pattern.
3.3 Response to Grid Charges (4CP)
Mining firms demonstrably reduce consumption during the summer months to avoid the 4CP charges. ERCOT calculates these charges based on a customer's average load during the four highest 15-minute peak intervals (June-Sept). This strategic demand reduction provides valuable flexibility to the grid during periods of highest stress.
4. Technical Details & Model
The Seasonal ARIMA model is denoted as SARIMA(p, d, q)(P, D, Q)[s]. The general form of the model for a time series $Y_t$ (transformed mining load) is:
$\phi_p(B)$ and $\theta_q(B)$ are the non-seasonal AR and MA polynomials of orders $p$ and $q$.
$\Phi_P(B^s)$ and $\Theta_Q(B^s)$ are the seasonal AR and MA polynomials of orders $P$ and $Q$ with seasonal period $s$ (e.g., $s=24$ for daily seasonality in hourly data).
$d$ and $D$ are the non-seasonal and seasonal degrees of differencing.
$\epsilon_t$ is white noise error.
The model was fitted to the data to forecast consumption based on its own past values and errors, incorporating seasonal cycles.
5. Analysis Framework & Case Example
Case: Simulating Miner Response to a Heatwave & Price Spike
Scenario: ERCOT forecasts a severe heatwave for a summer week, expecting high system-wide load and potential real-time electricity price spikes above $1000/MWh.
Framework Application:
Inputs: Feed forecasted temperature (e.g., 105°F), day-ahead electricity prices, and the current calendar period (within 4CP window) into the trained SARIMA model.
Model Prediction: The model, having learned the negative correlation with temperature and price sensitivity, predicts a significant drop in consumption from a baseline 500 MW to an estimated 150 MW for the affected intervals.
Grid Operator Insight: ERCOT can now reliably account for this ~350 MW of flexible demand reduction in its resource adequacy and dispatch models. This "virtual capacity" can offset the need to call on expensive peaker plants.
Outcome: Improved grid reliability during extreme events and more efficient market clearing, as the model reveals hidden flexibility.
This example demonstrates how the econometric model transforms raw data into an actionable forecast of flexible load behavior.
6. Industry Analyst's Perspective
Core Insight: This paper delivers a crucial, counter-intuitive truth: large-scale Bitcoin miners are not simple "price-taker" loads chasing crypto valuations in real-time. They are sophisticated, grid-aware economic actors whose primary short-term calculus is dominated by electricity input costs (market price + cooling) and grid tariff structures (4CP), not by the volatile output price of Bitcoin itself. This reframes them from being a pure grid liability to a potentially manageable, even beneficial, source of demand flexibility.
Logical Flow: The authors start with the observed problem (massive, growing mining load), challenge the obvious hypothesis (crypto price drives consumption), and let the data speak. Through robust correlation analysis and SARIMA modeling, they systematically eliminate crypto price as a key driver and isolate the true levers: temperature and local electricity price. The final link is connecting this behavior to the specific design of ERCOT's 4CP cost recovery mechanism, explaining the strategic summer curtailment. The logic is clean, data-backed, and compelling.
Strengths & Flaws: Strengths: The use of real-world regulatory and market data (ERCOT, SEC filings) grounds the study in practicality, not theory. The focus on the 4CP mechanism is brilliant—it identifies a specific, actionable policy lever. The methodology is appropriate and clearly explained.
Flaws: The major limitation, acknowledged but critical, is data granularity and transparency. Relying on aggregated or public reports masks firm-level heterogeneity. As the paper notes, responses are not uniform across facilities. A model based on better data—perhaps through a collaboration with ERCOT or a major miner—could reveal more nuanced strategies. Furthermore, the model is descriptive/predictive but not prescriptive; it doesn't optimize how grid operators should actively engage this flexibility through new market products.
Actionable Insights:
For Regulators (PUCT, ERCOT): Double down on cost-reflective grid tariffs like 4CP. They work. Consider designing new, faster demand response programs specifically tailored to the digital, automated nature of mining loads, potentially offering payments for sub-hourly reliability services.
For Mining Firms: Proactively model and communicate your flexibility to grid operators. This study provides the blueprint. By formalizing your demand response capability, you can transition from being seen as a problem to a paid grid asset, improving your social license to operate and creating a new revenue stream.
For Researchers: This is a template. Apply this econometric framework to other regions with high mining penetration (e.g., Kazakhstan, Canada). The next step is to integrate this consumption model into full grid-scale production cost models (like GE-MAPS or PLEXOS) to quantify the system-wide economic and reliability impacts, both positive and negative.
This research is a foundational step in moving the conversation about crypto mining's grid impact from ideological debate to data-driven engineering and economics.
7. Future Applications & Directions
Synthetic Data Generation: The validated model can generate public, synthetic datasets of mining load behavior, enabling broader academic and industry research without compromising commercial confidentiality.
Advanced Market Mechanisms: Inform the design of new ancillary service markets or real-time demand response programs that can explicitly contract with and compensate mining pools for ultra-fast load reduction, akin to a distributed energy resource.
Integration with Renewable Energy: Model how mining loads could be strategically placed and operated to absorb excess wind and solar generation during periods of low prices and high output, acting as a flexible "baseload" that improves renewable economics and reduces curtailment.
Cross-Asset Optimization: Future models could integrate mining activity with other firm assets, like behind-the-meter battery storage or renewable generation, to create optimized portfolios that maximize revenue across electricity and cryptocurrency markets.
Global Replication: Applying this framework to other major mining hubs (e.g., Scandinavia, Middle East) to develop a global understanding of cryptomining's interaction with diverse grid architectures and market designs.
8. References
Majumder, S., Xie, L., & Aravena, I. (2024). An Econometric Analysis of Large Flexible Cryptocurrency-mining Consumers in Electricity Markets. arXiv preprint arXiv:2408.12014v2.
ERCOT. (2024). Reports on Load Growth and Resource Integration. Electricity Reliability Council of Texas.
RIOT Blockchain, Inc. (2023). Annual Report (Form 10-K). U.S. Securities and Exchange Commission.
Du, P., Lu, N., & Zhong, H. (2019). Demand Response in Electricity Markets: An Overview. IEEE Power & Energy Society General Meeting.
Box, G. E. P., Jenkins, G. M., Reinsel, G. C., & Ljung, G. M. (2015). Time Series Analysis: Forecasting and Control. John Wiley & Sons. (For SARIMA methodology).
International Energy Agency (IEA). (2023). Electricity Market Report. – For context on global electricity market trends and digitalization of demand.